Using Microsoft Access with Power BI
We recently had a client who wanted to view his QuickBooks data in Power BI, but the former could not connect with the latter to get the data, so we resorted to exporting the data from Quickbooks, using Access to clean it up and finally upload it to PowerBI.com so that other employees can see the analysis.
Analyzing QuickBook Data
Although PowerBI.com can read QuickBooks data directly, (see https://docs.microsoft.com/en-us/power-bi/service-connect-to-quickbooks-online), our client needed reports that were not included. The solution we provided was an Access database which allowed them to easily import their data from QuickBooks using QB reports exported to CSV, then having Access clean up the data and merge it with local tables to obtain the results needed. We added code to Access that would upload the data from the csv file and save to access tables which were connected to PowerBI.com for reporting.
Once the database was set up with the required data, we provided the user with the Power BI desktop application and created a dashboard with the required visuals and the data source coming from the Access tables. In this case the client was using 32bit Access, so we installed the 32bit version of Power BI Desktop and installed Microsoft Access Database Engine 2010 Redistributable.
One of the clients requirements was to track the employee hours to ensure they reached their goals, each had weekly targets but they also wanted to see the target percentage over a selected date range, so for example if the target was 32 per week for an employee and the dates analyzed was two weeks, the goal should be 64.
Step 1: Add a date table
Firstly, we needed a date table that included every day of the year based on the data received. Using the New Table button on the modeling tab we were able to use a Dax expression that would create a date table that ranged from the earliest to the latest date in the activity table. In PowerBI we used the following formula:
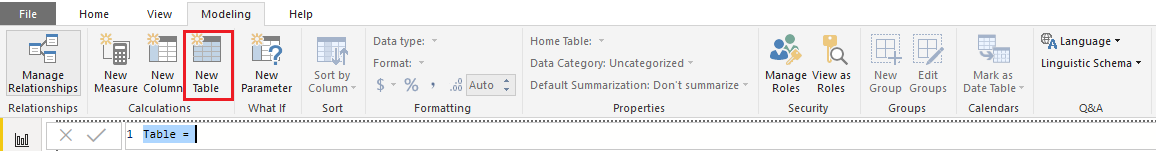
In your report, in the Modeling tab at the top of the Power BI window, select New Table.
You need to create the first column of the table which would be the date. Replace Table with your table name and then use the CALENDAR function to set the date range you want. In our example below we are using the dates in the table tblTimeActivities and Activity Date is the name of the date field. We are selecting the minimum date as the start date and the maximum date as the end date. By using this method the dates in the date table will grow as we import more data into tblTimeActivities.
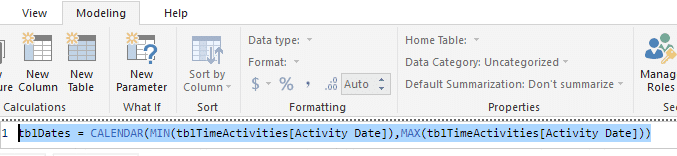
Alternatively, you can hard code your start and end date by using the following script:
![]()
Once you have the date column you can now add other date related columns that are required.
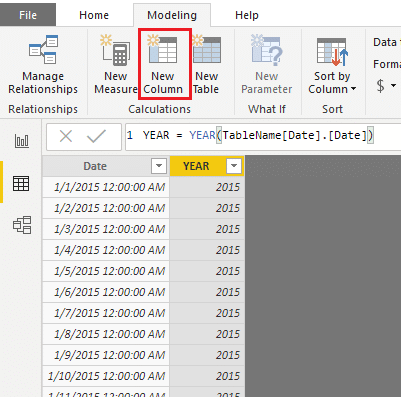
In the example here we are extracting the year of the date. Other options are:
Month = MONTH((tblDates[Date]))
Week = WEEKNUM(tblDates[Date])
Week Starting = tblDates[Date] + 1 – WEEKDAY(tblDates[Date])
MonthName =FORMAT (tblDates[Date], “mmm”)
The next step was to add a calculated column that would provide a day count for each date:
CalculatedDays = DATEDIFF(tblDates[Date],TODAY(),DAY)
We now need to create a couple of measures that would calculate the total target based on the date range selected on the slicer.
- Get the number of weeks in the date range:
WeekCount = ((MAX(tblDates[CalculatedDays])-MIN(tblDates[CalculatedDays]))+1)/7
- Calculate Target:
BillableTarget = MAX(tblEmployees[TargetBillableHrs])*[WeekCount]
The final step of this project was then to share the report with management using the web-based Power BI in Office 365. To resolve this, we simply published the report to the web and then shared the report with the specified users. Now because the data is not cloud based, we are unable to create a schedule refresh without creating a gateway connection. in this case because they already established a daily 3 step process for the main user, it was simply a matter of adding step 4:
- Export CSV file from Quickbooks.
- Import data to Access.
- Refresh Power BI desktop and review the reports.
- Publish to Power BI Web.
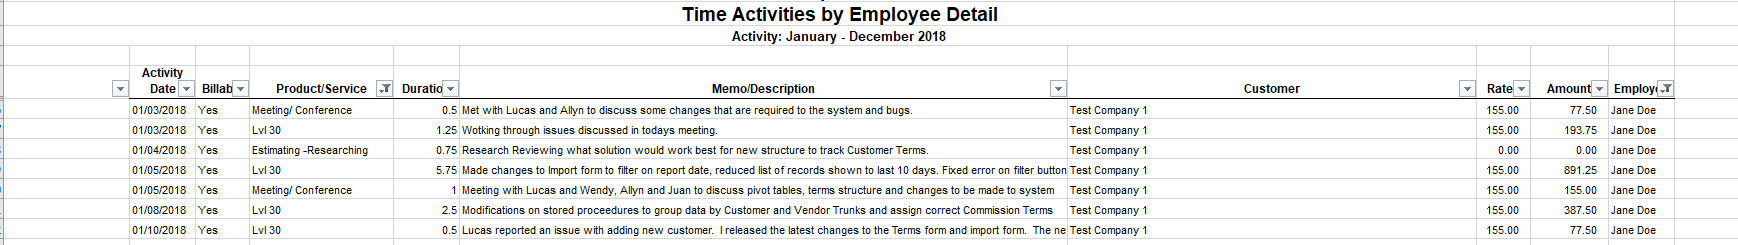
Exported Data Sample from Quick Books
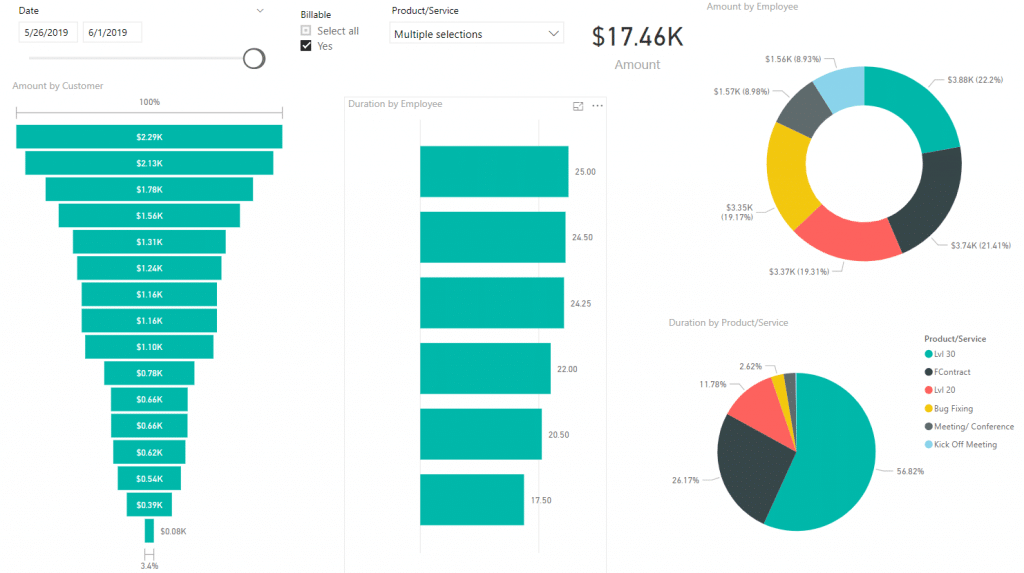
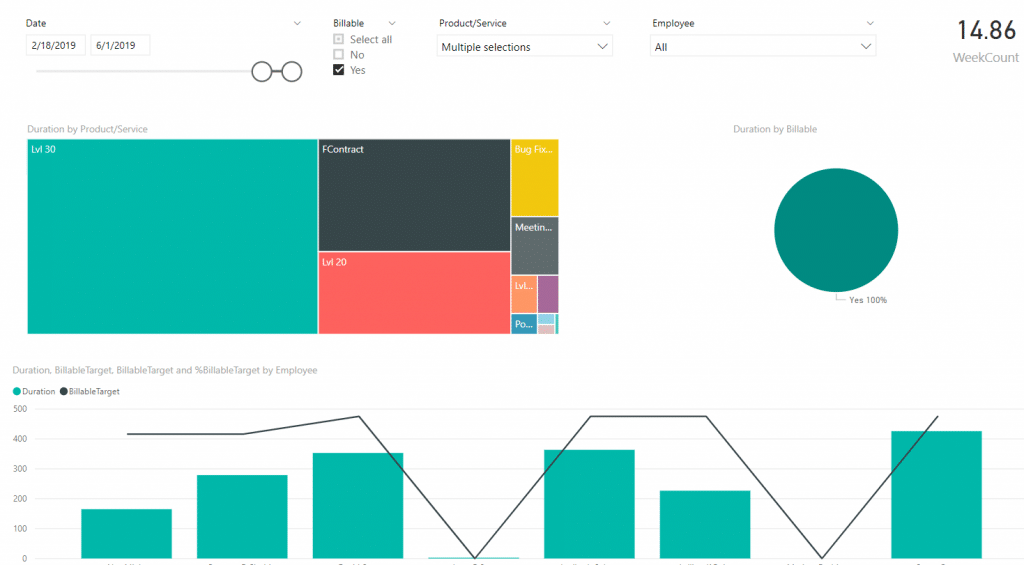
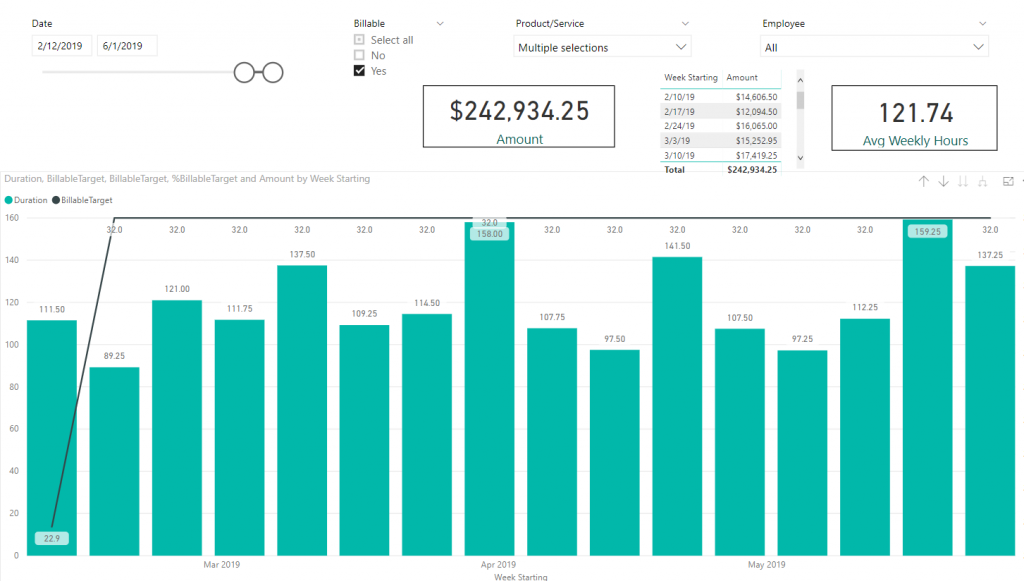
Final Report
Hi Juan, nice article but I’m curious why you didn’t use Power BI’s built in ETL capability (PowerQuery) to shape the data.
Hi Richard,
I understand we could have done that but the user needed to make modifications to the data each week and add additional information such as targets. The client preferred to use the access solution so they could easily manage the changes.
Nice article Susan. I’m curious, did you consider using QODBC to eliminate the need to export then import the QB data? Or OpenSync (which you may not be familiar with) which provides automated replication from QB to Access?
“based on the date range selected on the slicer.”
butI where is this date range selected on the slicer in
WeekCount = ((MAX(tblDates[CalculatedDays])-MIN(tblDates[CalculatedDays]))+1)/7
? It seems to me more like the range between the max and min dates in tblTimeActivities.
I’m sure all would be clearer if I could take a look at the relevant pbix.
Is the relevant pbix available?