This is a six-part series of articles on ODBC tracing to help Access developers troubleshoot and work with Access when developing an application that uses ODBC data source(s), usually but not exclusively SQL Server. The series aims to demonstrate how to use the ODBC tracing to monitor ODBC SQL statements that Access issues in the background when working with objects such as queries, forms or reports or even while executing VBA code against DAO objects. The series also will show how Access formulates the ODBC SQL statements. Finally, the series will cover how to interpret the tracing and identify potential problems. The articles will be printed daily until the series concludes.
UPDATE: Added a registry key for 32-bit C2R install on 64-bit Windows. Thanks, Jack MacDonald!
How many times have you heard “I don’t know why, but jiggling the handle just works”? Whenever I get that kind of response, it irritates me because it’s so unsatisfying. I would be very concerned if my plumber told me he didn’t know a p-trap is for and kept on referring to it as “that curvy thingamijig under the sink”. Likewise, my clients ought to be very concerned if I said “I don’t know why that query was slow, so I tried few random things and hey, I found a trick that works. I dunno why, though.” It’s possibly one of the greatest banes of software development — we are working with a complex system that amounts to flipping between 0 and 1 very rapidly in a certain sequence and are expected to know why it didn’t do that way instead of this way.
I believe that it’s worth the time and investment for the developer working with Access and VBA to get to really know what it’s doing, especially with an ODBC backend. We’ve had migration scenarios where we might not have access to the server-side profiling tools for different reasons, but that should not be a reason to shrug and just randomly mash buttons until something works. More importantly, having a solid understanding of what’s going on under the hood helps you become much better at predicting what performance fixes you need to apply for a given scenario. I submit that even if all you did was read the series and learn how Access works with ODBC data sources, you will be much better equipped simply because you know what Access is likely to do.
For more complicated scenarios, tracing can usually do wonders in revealing why things are running so slowly. Because you can trace it on Access side rather at the server, it does not require elevated permissions beyond having the access to the registry key to enable ODBC tracing. The added bonus is that this works for any ODBC data sources, not just SQL Server so if you have a client that’s using MySQL or PostgreSQL which you know nothing about, ODBC tracing still will help you identify potential issues that you can then address directly on Access’ side.
The series will focus only from the context of Access and DAO. Things may be different when we use ADO in VBA but that’s not in scope for now because whenever we use DAO, Access will do several things to satisfy our otherwise impossible requests. A good example is an Access query that references a VBA function. You can’t run VBA function on SQL Server, yet Access does not complain. So what really is happening behind the curtain? We can discover what Access is doing by tracing the ODBC SQL commands it issues to the ODBC data sources.
Much of information presented in this series of articles is made possible with the help of Microsoft’s old whitepaper on Jet & ODBC. Though I think the information is still very benefical, it is also quite dense and requires high level of technical proficiency. It is hoped by going through the tracing series, it will help make sense and present the information in a more accessible manner.
Why should we trace ODBC? How will it help me?
If you’ve ever experienced any of those symptoms:
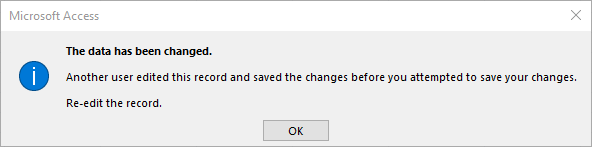
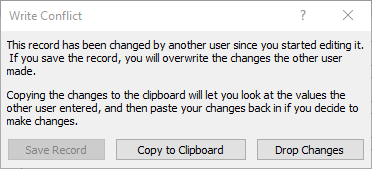

Or any other errors when working with an ODBC linked table, then it is beneficial to understand why you are getting those messages and how you can fix them. A common fix several Access developers apply is to either add Requery or try to save the records. While that might solve some of the problems, it’s not unheard of to see a complex Access form being liberally sprinkled with Requery and several cascading event chains that the performance start to suffer. Instead of sprinkling them as if they were magic pixie dust, we should be more surgical in our approaches toward fixing issues with the application.
Another compelling reason is to be able to analyze why a particular form A takes 10 seconds to open but a similar form B only 2 seconds to open. Instead of taking time to shuffle things around to find what makes form A open more quickly, you can start by tracing and compare the difference and then focus on the difference to help you fix the problems in a more direct manner.
Even if we do not always end up tracing every time there’s a performance problems, having the familiarity of what Access ought to do is of immense value. So even if all you’ve done is read the series, hopefully you will have a better appreciation of how to work with Access rather than against.
Access SQL and ODBC SQL dialects
Before we get into the details, we need to recognize that whenever Access works with an ODBC data source, it must first translate its SQL statement into a valid ODBC SQL statement. This is distinct from the target SQL dialect of the backend (e.g. SQL Server, Oracle, MySQL, PostgreSQL). The ODBC SQL grammar is described here. You also can see a list of all functions supported by the ODBC layer as well. It’s important to remember that when we are using ODBC, we aren’t actually directly translating from Access SQL to the data source’s native SQL dialect. Rather, we are translating Access SQL into ODBC SQL which the ODBC driver for the given data source will then translate into its native dialect. If you can imagine an Japanese speaker and French speaker who do not speak one other’s language but both does speak English, that is basically what is happening over the ODBC layer. A further consequence is that just because the ODBC dialect supports feature X, does not mean that either side supports it. Both sides must support that feature X for it to be portable over the ODBC layer. Fortunately, most ODBC drivers out there are fairly broad and do a good job of covering most of the features. If you should encounter a situation where a feature is supposed to work but doesn’t, it may pay to consult the ODBC driver’s documentation to verify it’s supported.
Enabling ODBC SQL tracing
The first thing to do so that we can peek behind the curtains is to enable the ODBC SQL tracing. Though we can use SQL Server Profiler, looking at how Access formats the ODBC SQL is very helpful. It will work with any ODBC data sources and not just SQL Server. More crucially, this lets us view how Access is translating its queries to ODBC in a more direct manner than the SQL Server Profiler or other server-side profiling tools. You do not need any special permissions to use ODBC SQL tracing whereas server-side profiling tools may require a high level of permission to use. The enabling of ODBC SQL tracing is a registry setting so we can configure this by going to the appropriate registry key:
Jet database or Office versions before 2007
For 32-bit Windows:
HKEY_LOCAL_MACHINE\SOFTWARE\Microsoft\Jet\4.0\Engines\ODBC
For 32-bit Jet engine or pre-2007 Office on 64-bit Windows:
HKEY_LOCAL_MACHINE\SOFTWARE\WOW6432Node\Microsoft\Jet\4.0\Engines\ODBC
Note: There are no 64-bit version of the deprecated Jet engine.
Office 2007 to 2016 (MSI installs)
For 32-bit Office on 32-bit Windows, or 64-bit Office on 64-bit Windows:
HKEY_LOCAL_MACHINE\SOFTWARE\Microsoft\Office\X.Y\Access Connectivity Engine\Engines\ODBC
For 32-bit Office on 64-bit Windows:
HKEY_LOCAL_MACHINE\SOFTWARE\WOW6432Node\Microsoft\Office\X.Y\Access Connectivity Engine\Engines\ODBC
(where X.Y corresponds to the version of Office you have installed)
Office 2016 or Office 365 (Click To Run)
For 32-bit Office on 32-bit Windows, or 64-bit Office on 64-bit Windows:
HKEY_LOCAL_MACHINE\SOFTWARE\Microsoft\Office\ClickToRun\REGISTRY\MACHINE\Software\Microsoft\Office\16.0\Access Connectivity Engine\Engines\ODBC
For 32-bit Office on 64-bit Windows:
HKEY_LOCAL_MACHINE\SOFTWARE\Microsoft\Office\ClickToRun\REGISTRY\MACHINE\Software\Wow6432Node\Microsoft\Office\16.0\Access Connectivity Engine\Engines\ODBC
Under the key, locate the key TraceSQLMode and change the value from 0 to 1.
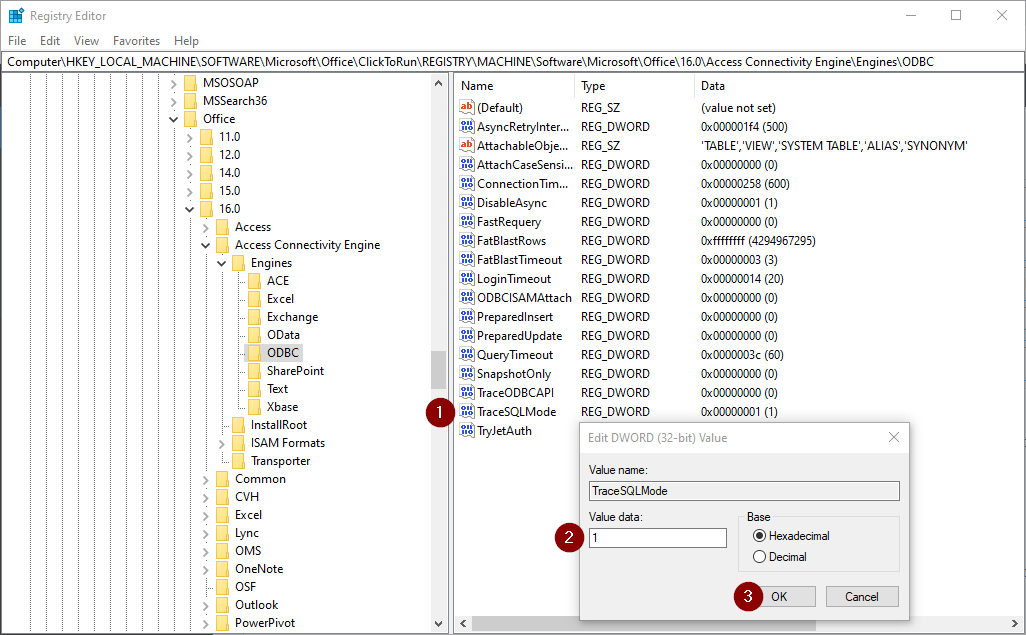
Registry key for enabling/disabling ODBC SQL tracing.
Access will need to be restarted if it’s already open. Otherwise, open it and run some queries. A file named sqlout.txt will be created in the current directory. That is typically in either in the same folder as the Access file OR in the documents folder. Alternatively, you can execute VBA function CurDir to determine the current directory.
I recommend using Notepad++ or a similar text editor which has the capability to detect that it was modified. It will then prompt to reload the file. That enables you to view new updates as Access emits new commands to the text file without constant reopening. When you activate the text file, Notepad++ will show a dialog:
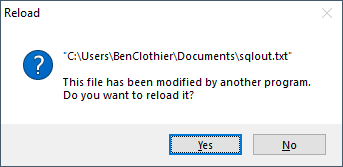
Notepad++ reload prompt dialog displays whenever a text file was edited outside Notepad++.
You can then click Yes to see the latest ODBC SQL commands issued by Access. Because Access can issue several ODBC SQL commands, the log can grow quickly. I find it convenient to get to the point where I want to trace something (e.g. about to open a form or run a query), I then switch to the sqlout.txt, reload it, then select all, delete all the text and then save the now-empty file. That way, I can execute the action I want to trace, then only see the relevant ODBC commands without all other noises that has nothing to do with the action being traced.
Here’s a quick video to demonstrate:
Conclusions
You’ve learned how to turn on ODBC tracing and view the output generated by Access. You can see that you can collect output even from actions such as simply opening a table or running a query. That gives you insights into what kind of SQL queries Access is actually sending to the ODBC data source.
As you can see, ODBC SQL tracing captures all ODBC SQL commands issued by Access even if you didn’t directly issue it. Therefore, you can use it at any point where you are experiencing slowdowns for where you don’t have a good explanation. As an example, suppose you have a form that’s slow to open and you’re not sure it’s your VBA code in the form’s Open or Load events or the recordsource that’s the problem. A strategy would be to set up the Access application so that you are about to open that form, clear the sqlout.txt text file then proceed to open the form. You can then review the traced ODBC SQL statements and determine if there are any that can be improved.
That is particularly valuable when you are dealing with a complex form or report that also contains subform/subreports or contains comboboxes or listboxes which issues their own queries to satisfy the rowsource property.
In the next article, we will analyze the output when we browse through records.
Need help with Microsoft Access? Contact our team on 773-809-5456 or email us on [email protected].
Ben – yes, it works like a charm. I used the knowledge gained in Part 2 to clean up a form that opens with the application. It originally generated about 35000 lines in the sqlout.txt file, and a couple hundred after identifying the rogue component and moving the whole thing into an SQL View. The problem involved a VBA function in the Access query which I did not realize was such a drain on performance. I managed to eliminate the function and it runs much better now. Thanks for the insight provided by your blog posting.
That’s wonderful! I am glad you were able to use the information and optimize before the series concluded! You can appreciate how powerful tool it can be for troubleshooting performance issues without all the second guessing. I hope the rest of the series will be as beneficial. Thank you for sharing!
I’ve been stumbling in the dark trying to understand best practices, so I am looking forward to the series.
This is where I found the registry key for 32-bit Access 2019 on Windows 10:
Computer\HKEY_LOCAL_MACHINE\SOFTWARE\Microsoft\Office\ClickToRun\REGISTRY\MACHINE\Software\Wow6432Node\Microsoft\Office\16.0\Access Connectivity Engine\Engines\ODBC
Is there a trick to exporting a .REG file, and then running it to change the Registry key semi-automatically? I created a pair of .REG files to set the key ON and OFF, but they don’t have any effect. Here is the ON file:
Windows Registry Editor Version 5.00
[HKEY_LOCAL_MACHINE\SOFTWARE\Microsoft\Office\ClickToRun\REGISTRY\MACHINE\Software\Wow6432Node\Microsoft\Office\16.0\Access Connectivity Engine\Engines\ODBC]
“TraceSQLMode”=dword:00000001
Thanks for the feedback, Jack! I will double check when I am able to get to a 32-bit Access 365 but I want to ask:
* You don’t have a key in this pathHKEY_LOCAL_MACHINE\SOFTWARE\Microsoft\Office\ClickToRun\REGISTRY\MACHINE\Software\Microsoft\Office\16.0\Access Connectivity Engine\Engines\ODBC? Normally registry entries for 32-bit programs are put in theWow6432Nodebut I thought it is not applicable for 365 installs which is why I didn’t list theWow6432Nodepath in the article originally. I will double-check this.* Did you restart Access when you changed registry keys? If Access is already running, it won’t have any effect; it must be restarted afresh in order to take effect.
* You should also double check what the VBA function
CurDir()return and then check that folder to make sure that thesqlout.txtis created there. Typically that will be your documents folder but that’s not always the case.Thank you, Jack MacDonald for the question. I verified that the
Wow6432Nodepath is the correct one to use for 32-bit Access, even if it’s a C2R install. I’ve updated the article to reflect this. Hopefully you are able to create thesqlout.txtfile.Long overdue deep dive into the sometimes pleasant, sometimes troubled, relationship between Access and SQL Server and their intermediary partner, ODBC.